Track T-Cell Activation
During T cell activation, cell proliferation and increase in volume are two critical parameters that
CASY tracks very precisely at the same time. In the example below, human CD4 T cells were
stimulated with anti-CD3/CD28 Dynabeads
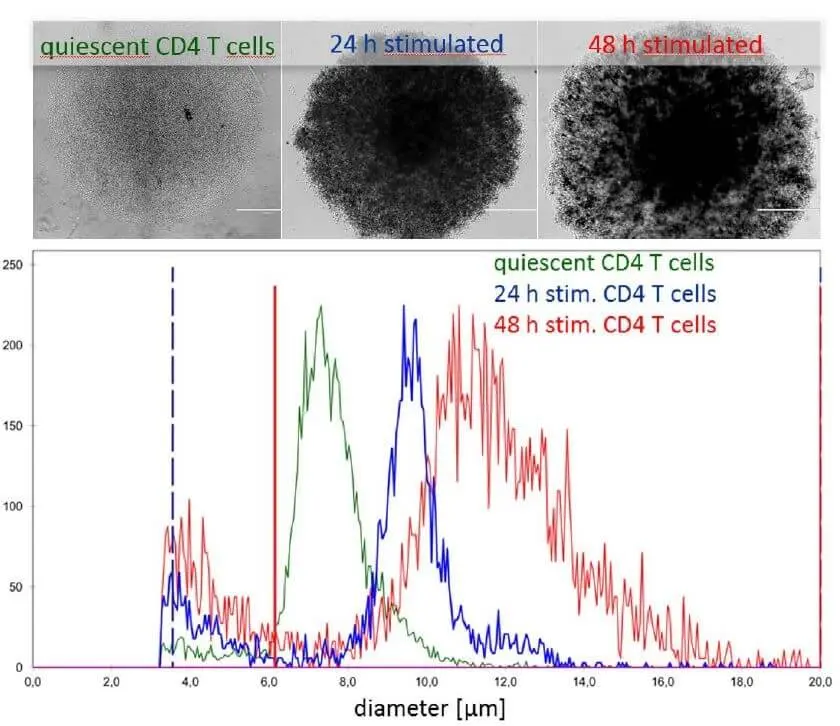
“Normal” cluster formation and cell size distribution during CD4 T cell stimulation.
Top: Cluster format in the initial phase of activation of human CD4 T cells.
Bottom: CD4 T cells increased their cell size from 8 µm in freshly isolated quiescent T cells (green line) to 10 µm after 24 h (blue line) and finally to 12 µm after 48 h of stimulation (red line).
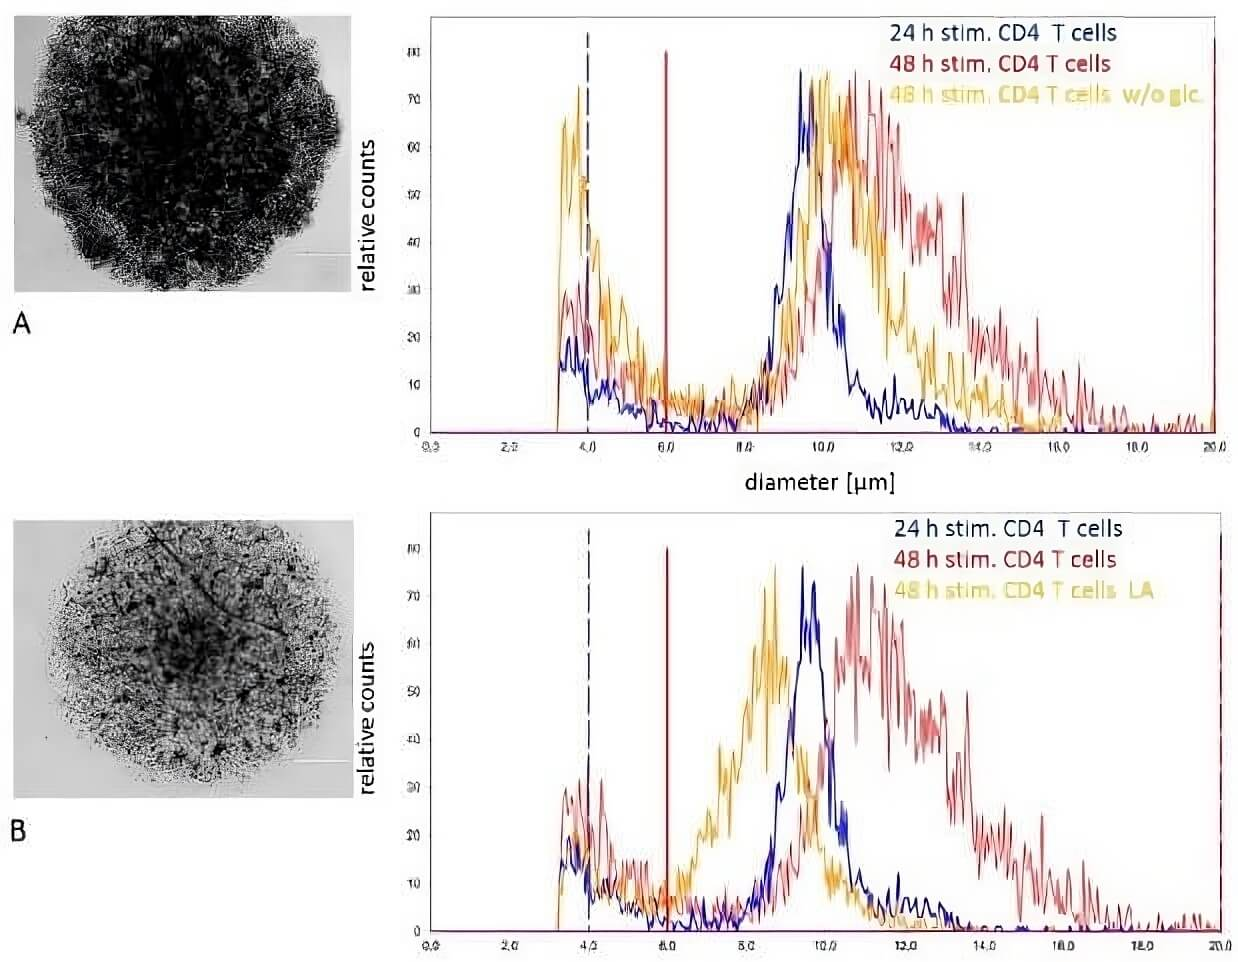
Cluster formation and cell size can vary significantly under different metabolic conditions, such as glucose deprivation (A) or lactic acid presence (B).
Whatever the impact is, CASY delivers precise cell counts while also allowing detailed analysis of volume shifts in each measurement.